

What are the key metrics for a Saas company? If you’re not sure, then this is the blog post for you. We’ll cover 16 important SaaS marketing metrics that will help your business succeed in the long run. We’ll also go over how to set them up so that they work well with your goals and marketing strategy.
1. Customer Acquisition Cost (CAC)
Your customer acquisition cost is the sum of all your marketing costs, including advertising expenses and labor/employee time. Your CAC helps you determine how much money it will take to acquire a new customer. This can be either by using different channels or when focusing on one channel in particular, such as email marketing for example.
You have two options when it comes to reducing your CAC: increasing revenue or decreasing costs. You’ll want to track this metric over time so you can see whether your marketing efforts are paying off.
How to set it up:
You can calculate your CAC manually, or use software such as Mixpanel that will do the calculation for you.
CAC = total marketing expenses ÷ total new customer acquired
You can then use this number to determine how many customers it will take for your business to break even on the cost of acquiring them – at which point, they’ll start paying off their acquisition costs through monthly recurring revenue!
You can also use this formula for your own calculations based on what’s important to track in your business model. For instance, if you are running a freemium model, you’ll want to track your average conversion rate from free users to paying customers.
Keep in mind:
Be sure to use a realistic timeframe when calculating your customer acquisition cost. For example, don’t calculate it over the course of a year if you’re only running a six-month marketing campaign.
2. Activation
The first step to measuring your activation rate is trying to find out what you mean by “activation.” Activation can be measured in different ways according to the actions that users take. For example, customer success teams might define it as when a user finishes onboarding or takes their first action within an app.
For SaaS metrics, however, you might want to consider tracking activation as when a user becomes a paying customer. You’ll also want to track how long it takes for users to activate, and whether they continue using your product after activating.
How to set it up:
There are a few ways to measure activation, depending on what actions you’re looking at. One way is to track how many users take a certain action, such as signing up for your product or upgrading to a paid account.
You can also use cohort analysis to measure activation. This looks at groups of users who activated during different periods (such as days, weeks, or months) and compares their behavior over time. For example, you could look at how many of those users are still active after a certain period of time. You can set up conversion tracking in Google Analytics or similar tools for tracking this.
Keep in mind:
Make sure you’re tracking the right actions that indicate activation – not just any action taken by a user!
Also, it’s important to track whether users continue using your product even after they’ve been activated. This will help you determine whether they find your product valuable and whether they got what they wanted from it.
3. Retention
Retention is another key metric to track, as it tells you how many customers are sticking around after they’ve been activated. This can help you determine the health of your business and whether users are finding value in your product.
There are a few ways to measure retention: by time (such as days, weeks, or months), by activity (such as how often users log in or use your product), or by cohort (comparing different groups of activated users).
How to set it up:
Retention can be measured in a number of ways, but the most common is to track how many customers are still active after a certain period of time. You can do this by setting up a goal in Google Analytics or another tool for measuring active users.
You can also track how often customers are using your product by setting up event tracking in Mixpanel or another tool. This will tell you how engaged they are with your product and whether they’re using it regularly.
Keep in mind:
It’s important to track both active and inactive users in order to get a complete picture of retention. Also, make sure you’re tracking the right time period so you’re not measuring retention over too short or long a timeframe.
4. Monthly Recurring Revenue (MRR)
Of course, you’ll also want to track revenue so you can see how your SaaS business is doing. This metric tells you how much money you’re making from your customers.
There are a few ways to measure revenue: by time (such as days, weeks, or months), by customer segment (such as enterprise vs. small businesses), or by product (such as different pricing tiers). For SaaS businesses, one of the most important metrics to track is the monthly recurring revenue (MRR).
How to set it up:
Most SaaS businesses measure revenue by tracking MRR. You can do this by setting up a tool like Profitwell for measuring monthly recurring revenue. Tracking the total revenue your customers have paid you will also give you an idea of how much money they’re spending with your company, and whether that’s increasing or decreasing over time.
You should also track the number of paying customers and how much they’re spending, which will give you an idea of your average customer lifetime value.
Keep in mind:
You’ll also want to track revenue by customer segment – for example, enterprise vs. small businesses – so you can better understand where your SaaS company is making money and why certain types of customers are more valuable than others. You might find that not all segments contribute equally to overall revenue.
FAQ: What is “annual recurring revenue (ARR)?”
Annual recurring revenue (ARR) is a metric that measures the total amount of money a company will earn in a year from its existing customers. This metric is helpful for SaaS startups because it can indicate whether they’re growing their customer base fast enough to maintain or increase their annual revenue.
To calculate ARR, simply multiply your monthly recurring revenue (MRR) by 12. So, for example, if your monthly recurring revenue is $15,000 per month, you would have an annual recurring revenue of $180,000 ($15,000 x 12).
5. Organic Referral Rate
One of the best ways to grow your business is by word-of-mouth, so you’ll definitely want to track how many customers are coming from organic referrals. This metric tells you what percentage of new signups come through a referral and helps determine whether or not your users like your product enough that they’re telling others about it.
How to set it up:
It’s not easy to track this metric because it shows up as several different “sources” in your web analytics. The best way to get this information is to set up a short form that asks about how they found out about your tool and either include it in the onboarding flow or send it with the welcome email.
Keep in mind:
Make sure you’re tracking the right time period so you’re not measuring referral rate over too short or long a timeframe.
6. Customer Churn Rate
Churn rate is another important metric to track because it tells you how many customers are leaving your business. This metric can be measured in a few different ways: by time (such as weeks, or months), by customer segment (such as enterprise vs. small businesses), or by product (such as different pricing tiers). Knowing how many customers are leaving your tool will help you start the inquiry to understand why they’re canceling and what changes need to be made.
How to set it up:
You can calculate churn rate by taking the number of customers who canceled in a given time period and dividing it by the total number of customers. Most SaaS companies measure churn rate by tracking the number of active users from one month who don’t become active in the next month (or other time period).
Keep in mind:
It’s not always easy to track this metric because some users might drop off the first time they use your tool and never come back. You should make sure you’re considering “inactive” vs. “churned out” users when calculating your churn rate.
FAQ: What is “negative churn”?
Negative churn, as the name implies, is when new revenue from existing customers (expansion MRR) exceeds the amount of revenue you lose due to cancellations and downgrades (churned MRR).
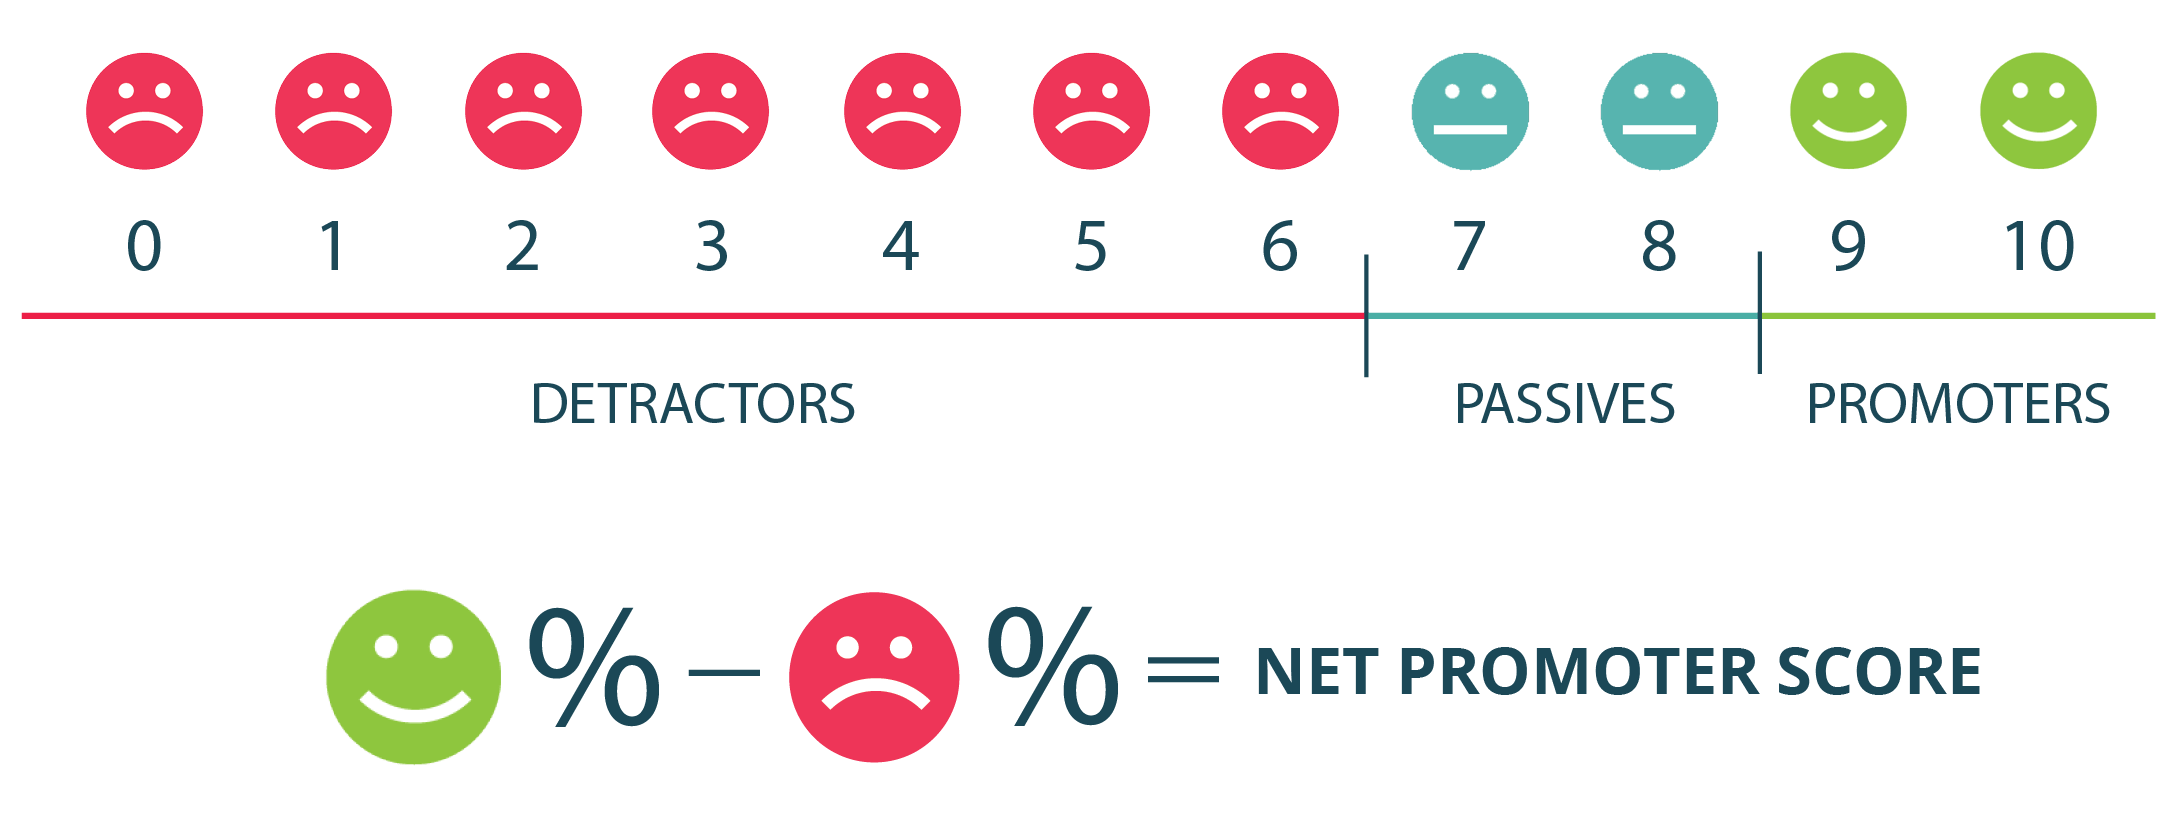
7. Net Promoter Score (NPS)
Another important metric to keep track of is your Net Promoter Score (NPS). NPS shows how likely users are to recommend your SaaS business, which will give you an idea of whether or not people like using your product enough that they’re telling others about it. An ideal score for most companies in the B2B space is around 50.
How to set it up:
NPS can be calculated by asking customers how likely they are to recommend your product on a scale from 0-100, with 0 being very unlikely and 100 being very likely. You can then track the percentage of respondents who answer with a score of nine or higher (promoters) and subtract the percentage of respondents who answer with a score of zero through six (detractors). You can use a tool like SurveyMonkey to easily set up and track this metric.
Keep in mind:
NPS can be tracked over time to see if your business is making progress in becoming more customer-centric. You should also segment your data by customer type or product usage to get a better understanding of who is most likely to recommend your product.
You should also make sure you’re considering all detractors – even if they only gave a low score because they had a negative experience with your customer success team.
8. Average Revenue per User (ARPU)
Another important metric SaaS companies to consider is the Average Revenue per User (ARPU). This shows how much revenue you’re generating on average for each customer.
How to set it up:
To find ARPU, take the total amount of money you’ve received from users in a given time period and divide it by the number of customers who paid during that time period. You can track this metric over time to see if you’re making progress in increasing your average revenue per user.
Keep in mind:
You should make sure you subtract any one-time payments, such as initial sign-up fees, from your total amount of money received to get an accurate calculation of ARPU.
You should also track ARPU over time to see how it’s changing, and segment your data by customer type or product usage to get a better understanding of who is generating the most revenue for you. A regular cohort analysis or a tool like Profitwell will allow you to do this by separating users into groups based on when they signed up with your business (e.g., month, quarter, year).
9. Customer Lifetime Value (LTV)
Customer Lifetime Value (LTV) is a metric that tells you how much revenue a customer is worth to your business over the lifetime of their relationship with you. This metric can be used to help make decisions about pricing, product development, and marketing efforts.
How to set it up:
There are a few different ways to calculate LTV, but the most common way is by multiplying your average revenue per user (ARPU) by the number of months they’re expected to remain active.
Keep in mind:
This metric can be hard to calculate for SaaS companies that don’t charge customers on an ongoing basis or offer free trials. You should break out your calculation by customer type to get a more accurate LTV.
You should also make sure you’re considering how long it takes for your customers to reach each stage of the buyer’s journey since this will affect their lifetime with your product.
Customer Lifetime Value (LTV) is an important metric that can help show you the value of your customers. By tracking this metric, you can make better decisions about pricing, product development, and marketing efforts.
10. Unique Visitors per Traffic Source
It’s very obvious that you should also track your unique visitors metric to see how many people are visiting your website or using your product and more importantly – where are they coming from. This metric can be used to measure the success of your marketing efforts and help you allocate resources where they’re most needed. Make sure you’re tracking unique visitors per traffic source and make decisions based on what you’re learning.
How to set it up:
There are a few different ways to track unique visitors, but the most common way is by tracking a unique IP address. This will show you how many people have visited your website from different locations around the world, and it’s important to track this metric over time so that you can see if more or fewer people are visiting your site after making changes to your marketing strategy. It’s very easy to track this with common web analytics tools like Google Analytics, Mixpanel, Heap, etc.
Keep in mind:
Look at this metric in the context of all the other bottom-line metrics that I’ve mentioned above because on its own, it can easily become a vanity metric that doesn’t show the real impact of the marketing efforts.
FAQ: What are “vanity metrics” and why you should avoid them?
Vanity metrics are measurements that look impressive on their own, but they don’t actually show the impact of your business’ operations. They can be very easy to track with common tools like Google Analytics, but you should avoid relying on them too much because they can mislead you into thinking your business is doing better than it really is.
Some examples of SaaS vanity metrics include:
- social media reach or engagement
- pageviews or unique visitors
- total registered users/customers
By tracking vanity metrics, you can easily mislead yourself into thinking your business is doing better than it really is. It’s important to track the metrics that actually matter and use them to make decisions about your operations. By doing this, you’ll be on the right track for success.
11. Marketing Qualified Leads (MQLs)
One of the most important KPIs for any SaaS company is marketing qualified leads (MQLs). This metric helps you define where to put your resources when it comes to growing your business. If more people are becoming MQLs, then this means there’s a good market opportunity and that things are working out with your marketing efforts.
How to set it up:
MQLs can be a little difficult for some SaaS companies, especially if they’re not tracking the buyer’s journey from lead generation all the way until becoming an MQL. You may have to segment your numbers by different groups of people who are visiting your website or downloading content – such as people who have filled out a form but haven’t become customers yet.
Once you’ve determined what constitutes an MQL, it’s important to track how many leads are reaching that stage every month and also see if that number is increasing or decreasing over time. You can do this by setting up goals in your analytics tool.
Keep in mind:
Tracking MQLs can be tricky because it’s not always clear when someone becomes a qualified lead. Sometimes people will download content, but they may not become customers for months or even years later. That’s why it’s important to track other metrics related to leads and customer acquisition in order to get a more complete picture of how your marketing is performing.
12. Product Qualified Leads (PQLs)
Just like MQLs, product qualified leads (PQLs) are an important metric to track for any SaaS company. PQLs help you determine whether people who are interested in your product are actually becoming active customers.
How to set it up:
Similar to how you would track MQLs, you’ll need to track the number of leads that are reaching the stage of being a PQL. This can be done by setting up goals in your analytics tool and tracking them over time. It might mean that they have finished certain steps in the onboarding process, integrated a key tool into your service, etc.
Keep in mind:
Since PQLs represent people who are interested enough in your product to actually start using it, you’ll want to track this metric closely and see if it’s increasing or decreasing over time. If the number of PQLs is going down, then you’ll know that you need to do something to re-engage those leads and turn them into active customers.
13 . Signups Growth
Signups growth is one of the no-brainer key SaaS marketing metrics that startups always track. This number shows how well you’re doing at attracting new customers and growing your user base.
How to set it up:
To track signups growth, you’ll need to determine what period of time you want to measure (e.g., monthly, weekly) and then track the number of signups for that period. You can do this by setting up goals in your analytics tool or using a spreadsheet to keep track of it manually.
Keep in mind:
Most SaaS companies experience seasonality with their business – for example, summers and holidays are usually slower in terms of signups growth compared to the rest of the year. Make sure you take that into account when tracking this metric and making marketing decisions based on it.
14 . Lead to Customer Rate
This metric is a measure of how successful your marketing efforts are at turning leads into paying customers. It’s one of the most important metrics to track if you want to know whether you’re making progress in growing your business.
How to set it up:
To track this metric, you’ll need to first determine what percentage of leads turn into customers. You can do this by dividing the number of customers you have by the number of leads you’ve generated.
Once you know that percentage, you’ll need to track it over time to see if it’s increasing or decreasing. This can be done by setting up goals in your analytics tool or tracking it manually using a spreadsheet.
Keep in mind:
There are many factors that can influence the lead-to-customer rate, so it’s important to track this metric over a long period of time (at least a year) to get an accurate picture. Some things that can affect it include your pricing strategy, the quality of your leads, and the effectiveness of your sales process.
15. Lead Velocity Rate
The lead velocity rate is a measure of how fast your leads are turning into paying customers. It’s a good indicator of how efficiently your sales process is working and can help you determine if you need to make any changes.
How to set it up:
To track this metric, you’ll first need to calculate the average length of time it takes for your leads to turn into customers. You can do this by dividing the number of days between acquisition and customer signup by two (if you’re measuring in days).
Once you know that figure, all you need to do is track over time to see if there are any trends. This can be done using goals in an analytics tool or a spreadsheet.
Keep in mind:
Since the lead velocity rate is dependent on many factors, it’s important to track this metric over time and compare results against other SaaS companies that are similar to yours. Some of those factors include your pricing model, how long you spend acquiring leads, and what type of customers you’re targeting.
16 . Expansion Revenue
One of the key goals for any SaaS startup is to increase their revenue from existing customers. This metric measures how well you’re doing at generating more revenue from your existing customer base.
How to set it up:
To track this metric, you’ll need to first determine what percentage of your total revenue comes from expansion sales. It’s easy to track this with a tool like Profitwell.
Keep in mind:
Since this metric is dependent on many factors, it’s important to track it over time and compare results against other SaaS companies that are similar to yours. Some of those factors include how long you’ve been doing business with your customers, the type of customers you’re targeting, and your pricing strategy.
In conclusion: why it’s important to measure the right metrics
Tracking these SaaS marketing metrics will help you get to the bottom of how many people are actually using your tool, where they’re coming from, and whether or not they’ll come back next month. This information is critical if you want to drive more revenue for your business through successful marketing campaigns, to test your SaaS business model, to validate the efficiency of your marketing team, and to make sure your customer satisfaction is high.


